About the Favorites Tab
Use the Favorites tab in the Test Session window to add, view and customize reports tab and test measurements while the test is running. A second set of Favorite measurements can be added on the “Favorites 2” tab. Favorite 2 measurement feature allows users to do generically like Favorite measurements, it will be up to the user to select which measurements go onto the Favorites 2 tab.
| NOTEs: The Favorites tab is persistent (present even when the test is not running), blank until you add the required test measurements, which are saved. |
| Add (+) / Delete (-) |
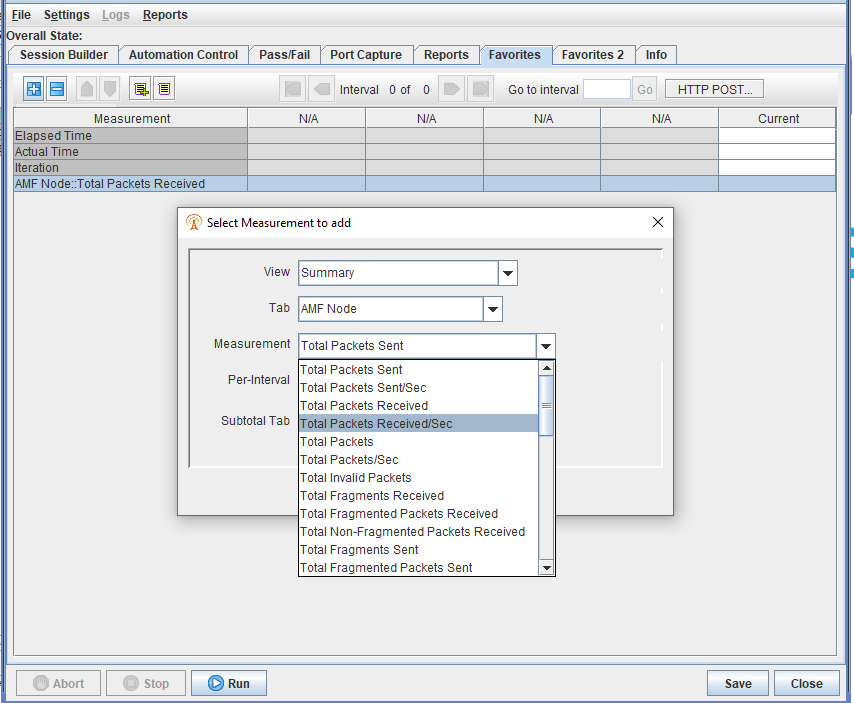
You may add a specific measurement definition from the Select Measurement to add window: to the Favorites tab just once for each specific instance, where each instance is uniquely identified by the View (Summary vs Test Case), Tab (test case dependent), mode (Cumulative vs Per-Interval), and/or subtotal tab. For example, your Favorites list may include all of the following:
|
||
| Up/Down Arrow | Select one or more measurement rows and click Up/Down arrow to order the measurements as required. | ||
| Add to QuickList | Click to add the selected item to the QuickList. | ||
| Display QuickList | Click to display the Favorites Measurement QuickList window populated with items you added. | ||
| Interval Navigation Buttons |
Use the interval navigation buttons to quickly shift the displayed intervals to a different stage of the test. |
||
| HTTP Post |
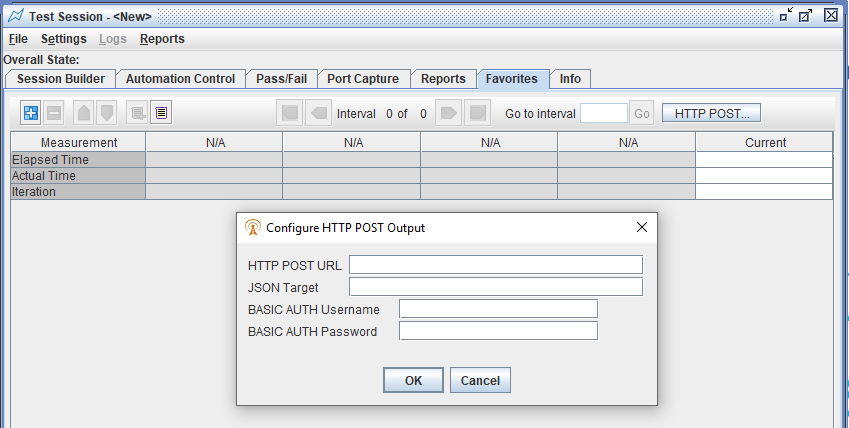
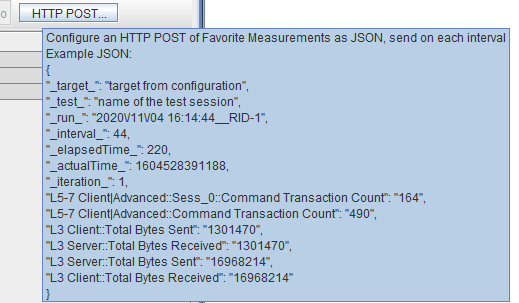
This feature allows for live reporting of the configured Favorite Measurements to an external server via HTTP POST in JSON format. An “HTTP POST…” button and the tooltip provides a sample view of the JSON that would be sent:
All of the fields prefixed and suffixed with _ are fixed, (in bold in the example below) and based on the configuration or TAS calculated items. They are header attributes and they should always be reported. The remaining fields are the list of Favorite Measurements and their values. When enabled the TAS will HTTP POST a message every interval with the current values for the measurements. Example : { First you must enable the feature by at least setting a URL and a target string:
The URL must be http or https, however https will only work if the server has an officially signed-by-public-CA certificate. We expect that this feature will be used inside a small network sandbox, lab or corporate network, and only require insecure HTTP. When using HTTPS, we currently do not provide any way to install certificates. To use HTTPS, you will have to use a SSL Certificate signed by one of the main/default CA providers that comes with standard Java8 Java. The other built-in JSON fields reported: If the TAS has any issues sending the HTTP POST, it will log warnings to the Run Log and RT Logs. If the HTTP POST fails more than 2 times it will stop sending the POST. A successful HTTP POST is when the TAS receives a 2XX response. Any other response is considered a failure. If you have configured the HTTP POST URL/Target and you did not receive any warnings , that means the TAS did send it. You can confirm this (and the contents) with Wireshark. Run log messages : Run Log Warnings (Failed login situation): RT Log Warnings (overall bad response from server situation):
Read the KPI Pipeline to Telegraf to learn how to send measurements to a Grafana Dashboard via Telegraf. |
||
| Hide Zero's |
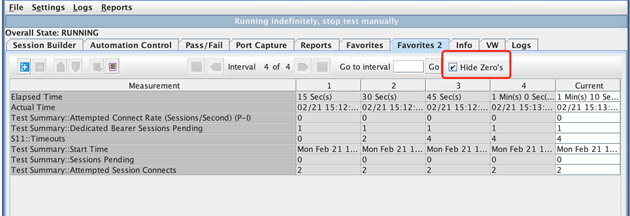
Along with the second Favorites we have added the ability to only show the measurements that have reported a non-zero value at least once. This is done using a check box “Hide Zero’s”:
By default, the “Favorites 2” tab will enable Hide Zeros. By default, the “Favorites” tab will disable Hide Zeros. This option is not persistent, if you change it in the GUI, it will not be saved with the test session. Also the end of test reports will not Hide Zeros, they will show all measurements. When editing the contents of the Favorites tabs, you may want to make sure you uncheck the option. And in some cases you will be forced to uncheck it. Moving and Removing Favorites while Hide Zeros is enabled, will not be supported. Until you start the test for the first time, this option will have no affect. Once you start the test, all measurements will disappear until they report at least one non-zero value. Current Limitations : |
Saving the Favorites List
| In Test Session |
The Favorites tab items are associated with the test Session and are automatically saved when you save the Test Session. The Favorites tab items set when a Test Session has already started are saved in the running Test Session. If you close the Test Session window and then reconnect to the test, the favorites list will revert to the list that was in effect when the test was started.
|
|
| In XLS/CSV |
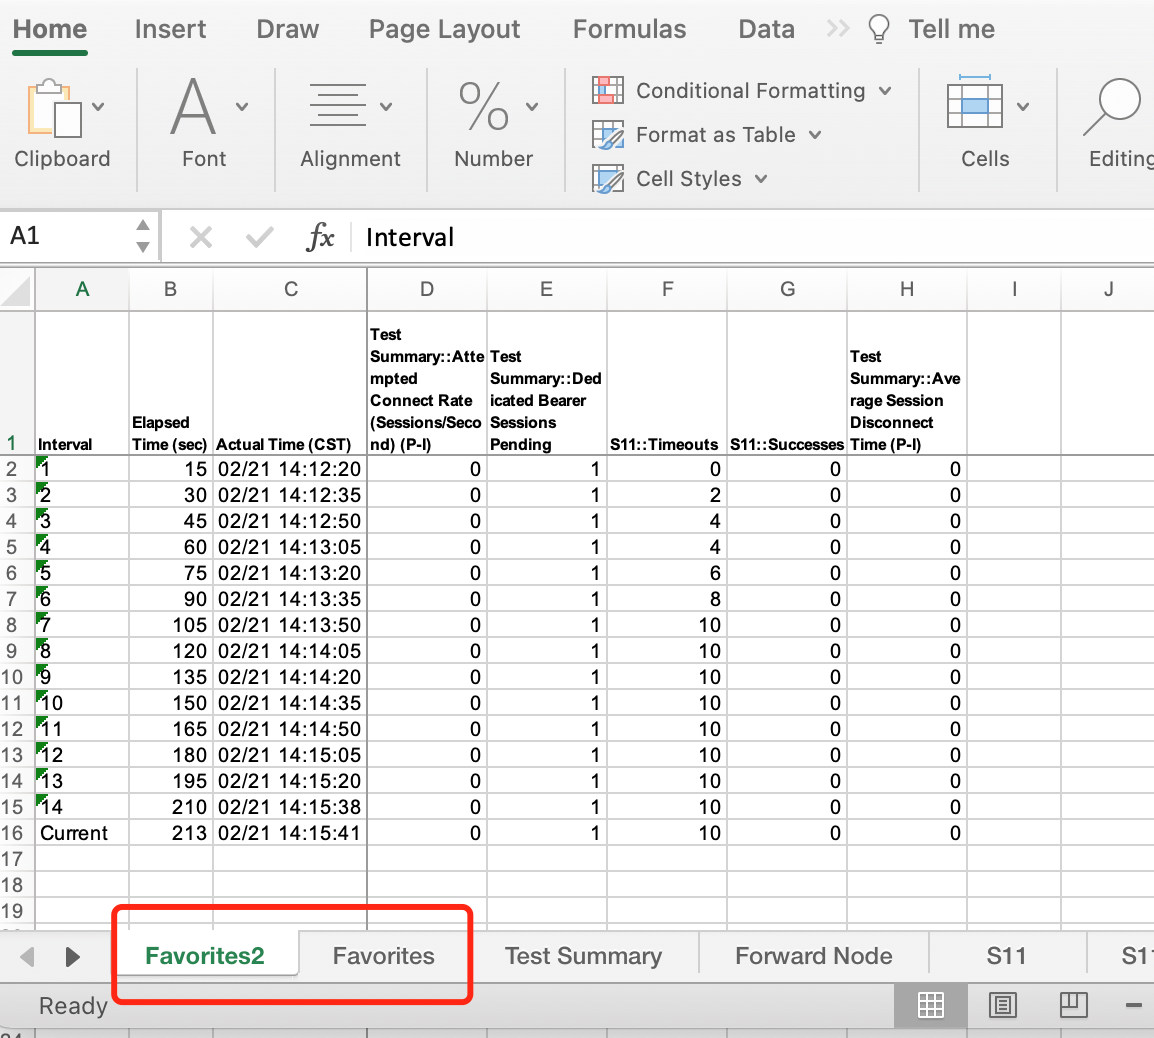
The items in the Favorites tab are also saved to XLS and CSV reports (see example), and is the first tab/section of the report. The new “Favorites 2” tab will be reported in the end of test .xls and .csv formatted reports:
Favorites 2 table will not be shown in TeX.
|
