About the Test Case Settings Window
The Test Case Settings window is displayed when adding a test case to a test session and when editing the test case. You may access the test case window through the Network Browser Tab (Test Selection Mode) and Session Builder tab in the Test Session window. Use this window to configure the parameters for the test case, the test activity, and any options added to the test case such as Data Traffic.
| NOTE: If this topic displayed when you clicked F1, you may wish to focus your cursor either on the tab in the test case settings panel or on the parameter help you wish to view. Hold down the left mouse key to maintain the focus on the radio button. |
The test case window contains two major panels, the test case diagram and the test case settings panel. Above each panel is a header bar with the panel title and a toggle button to collapse or expand the panel. Standard tree symbols (-/+) indicate the state of the header bar panel.
-
The window is labeled with the test case name and type.
-
Use the Name field to define the name of a local test case. If the test case is linked, the field is disabled and it displays the file name of the test case. Avoid using "[]" characters as they are used to indicate the Test Case Type when shown in combined form.
-
Select the Abort Test Session is not RUNNING to define an optional timer that will abort the entire Test Session if the Test Case (TC) does not reach RUNNING state after X seconds (Range : 1 to 65535, default : 10 ) and after Start or INIT. Select START (default) or INIT. Select START for the timer to start once the Test Case STARTING or STARTED state are received, and not when the TAS sends the Test Case start command. Select INIT for the timer to start once the Test Case INITIALIZING or INIT state are received, and not when the TAS sends TC init command. If after the configured time, the Test Case is not RUNNING, the TAS will abort the entire Test Session. Thus, any TC could Abort the entire test. See example below with TC set to abort after 10 seconds if the Test Case STARTING or STARTED state are not received.
-
Select the Intent of Test for the given Test Case and expect the appropriate record type in the VisionWorks CSV files. Only visible is licensed for VisionWorks. Options:
-
<use test default> - select to use the setting in the Test Session Report Options (Customizing Report Options - VisionWorks - Intent of Test)
-
Data - Select for Date Service Assurance Web Performance Data Analytics.
-
Enterprise - Select for Enterprise Service Assurance Machine-To-Machine Data Analytics. Configuration details can be found in the topic VisionWorks Solution.
-
VoLTE - Select for VoLTE Service Assurance - Voice Quality Service monitoring Analytics.
-
SMS-MMS - Select for SMS-MMS Service Assurance - SMS-MMS Quality Service monitoring Analytics. Note: When the user selects a Global Forced Intent of Test (e.g. SMS-MMS) in the Test Session Intent of Test, that will force every single record to use that Intent of Test. All other rules will not matter.
-
Network-Latency - Select for Network Latency Service Assurance - Network Latency Quality Service monitoring Analytics.
-
OTT-Apps - Select for OTT-Apps Service Assurance - OTT Apps Quality Service monitoring Analytics. (Example : INSTAGRAM, YOUTUBE, etc)
-
OTT-Video - Select for OTT-Video Service Assurance - OTT Video Quality Service monitoring Analytics.
-
NB-IOT - Select for Device Type support on MME Nodal Test Cnfg (CIoT), S1-MME Interface - NAS Tab
-
Emerg-Svcs - Select for Emergency Services Service Assurance - Emergency Services monitoring Analytics.
-
EXT_APPS_VPN - Select for UE emulation to a customer specified VPN server using OpenVPN - Available on MME Nodal test case - External App - OpenVPN.
-
INTERCARRIER - Select for MMS Client for MMS and EMAIL messages - Available on MME Nodal test case - External App - MMS Client.
-
Video-Streaming - Select for Video-Streaming Service Assurance - Video-Streaming monitoring Analytics
-
Voice-EPS - Select for Voice-EPS Service Assurance - Voice EPS Service monitoring Analytics.
-
VoNR - Select for VoNR Service Assurance - VoNR monitoring Analytics. Available on AMF Nodal N2/N3 and N6 support for monitoring and activation and IP Application Node for fault isolation for VoNR to separate issues between IMS core and 5G core.
-
Conference - Select for Conference Service Assurance - Conference monitoring Analytics. Note: When the user selects a Global Forced Intent of Test (e.g. Conference) in the Test Session Intent of Test, that will force every single record to use that Intent of Test. All other rules will not matter.
-
-
Tags - Select to define the Tags associated with the test case - Additional details below. Also available on the Customizing Report Options Window
-
Use the Extra Phys field to pick an extra physical port to associate to:
-
The following lists the components of the graphic test case window:
|
|
Buttons and Tabs
|


Test Case Diagram Panel
|
NOTE: The test case diagrams do not show every device that could receive or send traffic during a test but only shows those devices that are part of the test definition – either as a SUT or as an emulated node. The modify control plane protocol stacks are collapses and show first 2-3 layers, either a single L1-2 or L1-3 layer for ease of reference. |
-
<Off-Page> references are used to link a connection across multiple diagram tabs, similar to multi-page paper diagrams. This applies to tabbed diagrams only, currently only in MME Nodal, AMF Node/Nodal, Service Based Node/Nodal, SMF & UPF Nodals. Example :

User Interaction
-
General:
-
Click on a device that’s not disabled and to select/display the relevant settings tab.
-
Stack view :
-
Click the interface protocol stack and the interface settings tab displays. If the settings panel is collapsed when a device or stack is selected, it will be expanded.
-
IP Address View: Identifies Control [C] and [D] IP addresses and displays the required IP address assignment for the test case.
-
Click the IP address in the Network Diagram and the Test Case settings tab displays and highlights the panel.
NOTES:
|
Test Case Settings Panel
A variety of parameter types, fields, radio buttons, checkboxes, and drop-down lists, are used to define different aspects of the test, and these parameters are logically grouped in panes and on sub-tabs. Buttons with labels ending in "..." open dialog boxes containing more advanced or detailed parameters for a particular option. A parameter can become enabled (editable) or disabled (gray) depending on the selections you make in other parameters. The available settings for a parameter, for example, the items in a drop-down list, may also change based on the setting in another parameter.
Test Configuration Tab

Network Devices Tab

-
Select the System Under Test from the drop-down list. Add the SUT Query option with the Query checkbox.
-
Configure the network element emulators — the number of emulators, their IP addresses, and routing options — on the emulator tabs. With the Advanced... button you can direct an emulator to randomly discard packets.
Network Interface Tabs
|
NOTE: The selections in the Test Options pane can control whether an interface or protocol tab is visible. Only tabs with configurable settings are displayed. Selecting HA Node Emulation in ASN Nodal, for example, causes the R3 tab to be displayed with the MIP protocol tab. Changing the MIP Scheme selection to Simple IP in CSN Nodal adds a DHCP protocol tab to the R6 interface tab for the DHCP Client settings and a DHCP protocol tab to the R3 interface tab for the DHCP Relay Agent settings. When a protocol is dynamically added to an interface tab, its sub-tab is selected by default so that when you selects the interface tab the new settings are visible. |

-
The network devices tab title matches that of the interface stack in the diagram. In cases where the same protocol settings are used on more than one interface, the tab title indicates which interfaces are involved (e.g. R3/R6).
-
The settings for all available, configurable protocols are grouped in sub-tabs and are displayed on the left side of the panel. Protocol sub-tabs are stacked in the same order as the interface protocol stack. Where more than one protocol occupies the same layer, an attempt is made to stack the protocols in chronological order (For example, obtain an address via DHCP, then authenticate using RADIUS, then establish a session with MIP).
-
The L3-7 tab is used for Data Traffic, Data IPSec, and any other protocols involved in transporting data traffic from the Mobile Node to a Network Host.
In the Data Traffic pane, you can add bearer plane traffic that will be generated by the emulated Mobile Nodes and a Network Host emulator to respond to the MNs.

-
Large groups of settings are typically hidden when they are disabled instead of left visible and gray. For example, the IPSec tab displays different panes now depending on the IKE setting – pre-shared key, RSA signature, or pre-provisioned.
Additional Tab and Buttons
-
In most test cases additional tabs are available that allow you to define the control plane and transport protocol messaging options.
-
Use the View Measurements button to view the measurements associated with the test case and the variable names used to sample measurements with the API interface. Additional details in The Reports Tab , About Test Reports
NOTE: Measurements listed here (or in any measurement selector for Report Filters, Measurement Criteria, or Favorites) are not guaranteed to be reported in the running tests. These will include all the reported measurements, but could also include additional measurements that may not be reported in some configurations. A best effort to match exactly is made but it may not be perfect. They do not cover Sub-total measurements (Per-session/Per-DMF/Per-Bearer) that are created dynamically when the tests tun.
View Measurements Disclaimer - A Popup Dialog to the View Measurements window provides a disclaimer about viewing measurements. The popup dialog will use the " [ ] Do Not Show this message in the future" so a user can decide to not see the warning once they are given opportunity to read it.
Disclaimer - "The measurements shown in the next dialog will be a best effort at listing all the measurements reported by the test case. At minimum it will include every measurement reported by the test server. Additionally it may include measurements that are not reported by the test server. Some measurements are defined in case they are reported under dynamic conditions. Also, if the test case configuration is invalid, there will be a warning dialog next and the measurement list should be untrusted. The measurements you see in the dialog will match the lists of measurements you see in selection dialogs for Filters, Favorites, Pass/Fail Criteria and enywhere else that you are given an option to select measurements before a test is started. We provide View Measurements as a guide, but ultimately you must run a test to see what is reported for given configuration and live testing conditions. Clicking F1 on the view Measurements dialog will launch the related Help Page".
-
When measurements are defined with highlighting conditions, the conditions are visible in the View Measurements Dialog. Measurement tabs cover all Rejects, Failures, Timeouts, Errors and "Causes": - Additional details in About the Reports Tab.
-
Use the Help button to display the Help index for the test case. Context-sensitive Help is also supported at the parameter level by clicking F1. If this topic displayed when you clicked F1, you may wish to focus your cursor either on the tab in the test case settings panel or on the parameter help you wish to view. Hold down the left mouse key to maintain the focus.
-
Capture a snapshot of the window by pressing F9 to copy the snapshot to your clipboard. Save the snapshot with the Shift-F9 key combination.
-
Use the Tcl Button to display Tcl API Information, or also click F2 in the focus of a parameter...
-
Use the Meta Data Button of click F5 in focus of a parameter to use the Meta Data feature (link to the meta data popup dialog description).
-
Retain or discard your changes with the OK or Cancel buttons.
VisionWorks Tags
-
Select Tags to enter the VisionWorks Tags. A Pop-up window allows you to capture Tag #, Name and Value.
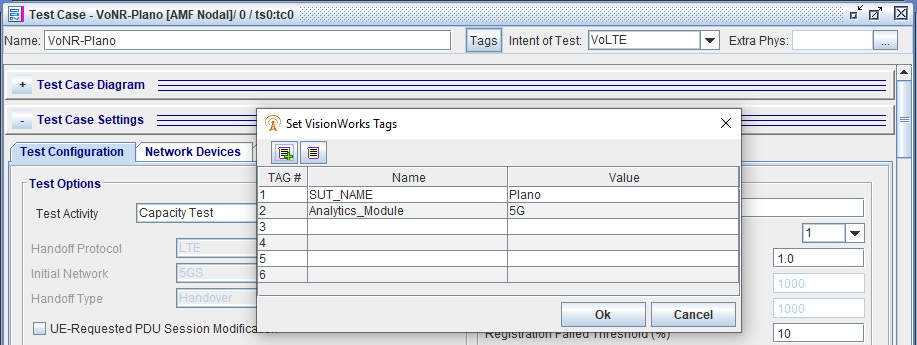

- The test case defined Tags will have higher precedence than the test session. Any Tags left blank in the test case will end up using the Tags from the test session. For example given: Test Session TAG1=Region=EAST, TC0 TAG1=Region-WEST, TC1 TAG1=<empty>, records produced by TC0 will have TAG1=Region=WEST and records produced by TC1 will have TAG1=Region=EAST, and any TEST.CRITS records that only apply at the test session level will have TAG1=Region=EAST.
- TAG Names can be up to 32 letters, numbers or underscores (_), but cannot start with a number.
- TAG Values can be up to 32 characters (with some special characters allowed, as indicated in the GUI).
- There are some predefined built-in TAG names available to select from (Network_Type, SUT_NAME, Analytics_Module, ST, VoLTE_Type, Region, LCC, Option, and Type), and a Custom tag name entry is available. Analytics_Module (5G) and Network Type values (SGi, N6) are required for IP Application Node based tests. SUT_NAME is required to display the SUT in VisionWorks Test Case Analytics.
- Network_Type - SGi value for SGi interface (EPC) and N6 for N6 interface (NGC) for those respective KPIs.
- SUT_NAME - Identify a SUT name in the Test Case Analytics context and link it to an entity through reference data (entity id field)
- Analytics_Module - 5G (used by Analytics for CRIT and PROC.)
- VoLTE_Type - GETS (used by Analytics in the context of GETS call)
- ST - used by Analytics in the context of Speedtest. KPIs for Speedtest server autoselection will look for this tag to be set to Auto vs KPIs for Speedtest server preset in test case will look for this tag to be set to Preset
- Region, LCC, Option, Type, Network_type - Any User Input
