About the Info Tab
The Info tab in the Test Session window provides the ability to monitor and "live-view" individual UE States/Information. Currently available in WiFi Offload Gateway Nodal (with RF Interface, GRE, CAPWAP, No Tunnel and Hybrid Access) and AMF Nodal, AMF Node, HA Nodal, IP Application Node with VoLTE, MME Nodal, Network Host and SGW Nodal, UPF Nodal for various Test Activity options.
|
NOTEs:
|
|
NOTE: May get NULL Values for items that are not reported by your test case. When setting a UE Info Level X (1 to 10), that means that the UE Info component will include fields A, B, and C. But that does not mean the test will always report B or C, thus the UE Info report will show a column for B or C and it would be null. for example, if using level 9 and you do not do a POLQA on Default Bearer, you will get POLQA columns, but they will always be null. |
The Info Tab is split into two sub tabs:
-
Configuration and Live view of UE Info - Setup/Live
-
Configuration of Pass/Fail Criteria based on the values inside the UE Info report - End of Test Criteria
UE Info Monitoring/Reporting (Setup/Live):
"Configure" the ranges of UEs to monitor and live report:
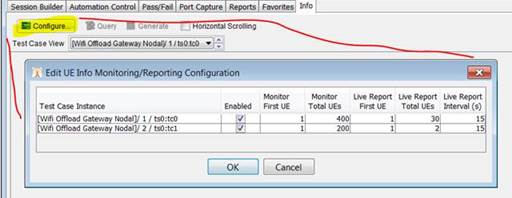
|
NOTES:
|
UE Info Monitoring/Reporting Configuration tab components:
| Test Case Interface | Test Case - List of available Test Cases that can be monitored. If no test cases are supported this will be displayed on Info Tab:   
|
| Enabled | Use this Flag to Enable the Test Case for monitoring. Cannot Enable/Disable during "Live" test. |
| Monitor First UE | Enter First UE in the Test Case to monitor. Default = 1. Cannot edit during "Live run". |
| Monitor Total UEs | Enter total number of UEs to monitor. Default = 1000. Cannot edit during "Live run". |
| Live/ Report First UE | Enter First UE to monitor. Default = 1. Able to change during "Live" run. |
| Live/ Report Total UEs | Enter Total UEs to Monitor. Default = 32. Able to change during "Live" run. See Example of "Live" run below. If changed to zero during live run, reporting will stop however monitoring is still on. If total assignments to monitor exceeds the 1000/32 UE limits, this error will be displayed: 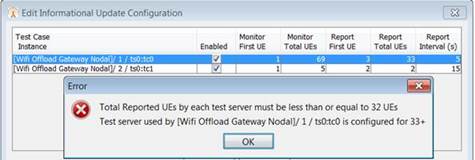 |
| Report Interval (s) | Enter the Report Interval. How often the TS will report updated values for the UEs being monitored. If changed to zero during live run, a final update will be generated for all live UEs and periodic updates will stop. Range : 0 to 60 seconds (See Error if not in range) 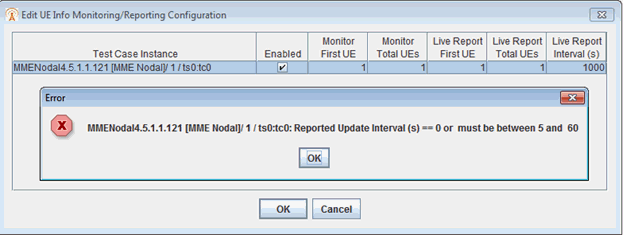 |
Live view of UEs 3-6 on a Wifi Offload Gateway Nodal test case:
| NOTE: When the Antennas report their ON/OFF status to the Info tab, they report it starting from the left and move right through all the Antennas. Once it encounters an Antenna in the off mode, it will stop scanning for Antenna status. For example, if Ant 1 and Ant 3 are turned on but Ant 2 is turned off, the Info tab will display that 1 Antenna is enabled. If Ant 1 is off and Ant 2 and Ant 3 are enabled, the Info tab will display no Antenna information. |
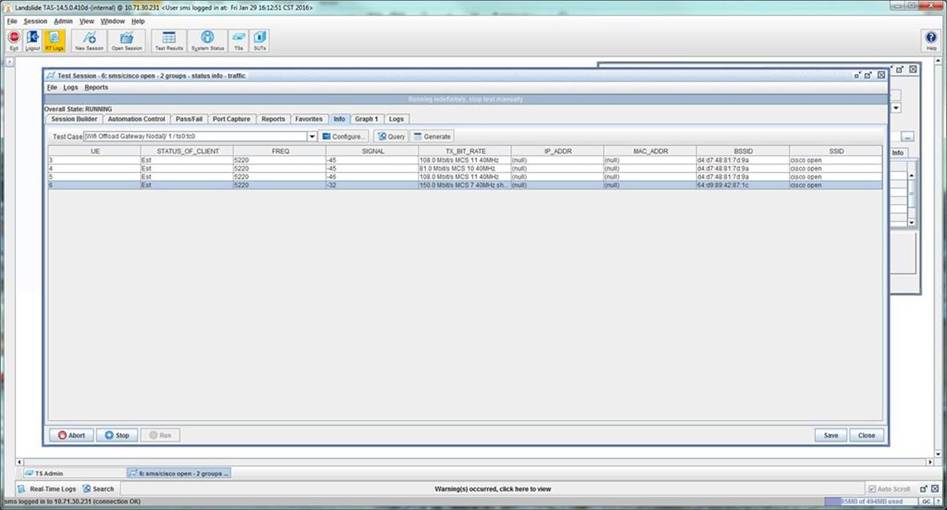
May change the range of UEs being monitored live, by clicking on the ![]() button and changing the UE ranges.
button and changing the UE ranges.
The Live UE Info page has a few other features.
-
May switch current viewing Test Case ,
 (as in Measurements/Reports.
 -
Send request to TS to Generate the full .csv report,
 .
. -
Query for historical information of selected row/cell/column,
 (or right-click). Can Query Historical data by UE, COL or Cell for Live Report UE's.
 -
Table can be scroll-able (with horizontal scroll bar) in the window to expand the table columns wider or narrower than the window,

When a row, column or cell, is selected (or right-click mouse on row/cell) the Query button is enabled.
Query options:
-
Can Query Historical data by UE, COL or Cell for Live Report UE's.
-
Historical range limit: 1000,
-
Live UE limit: Max 32 Windows
-
Historical Query rows limit : Recent 200 records.
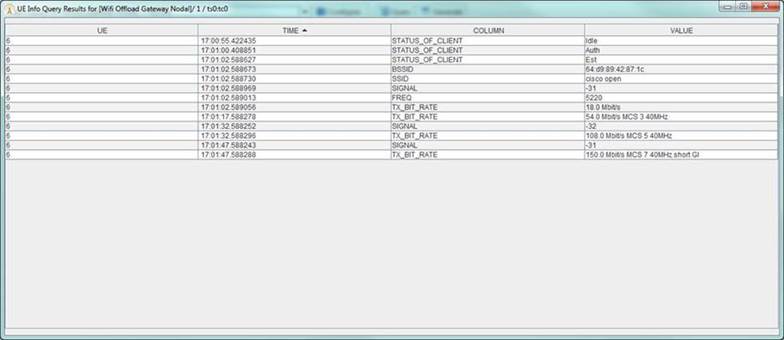
(Query selected UE's History), e.g. selected a single row, Query UE 6's history for all fields. This is just actual event recordings, time, field, new-value.
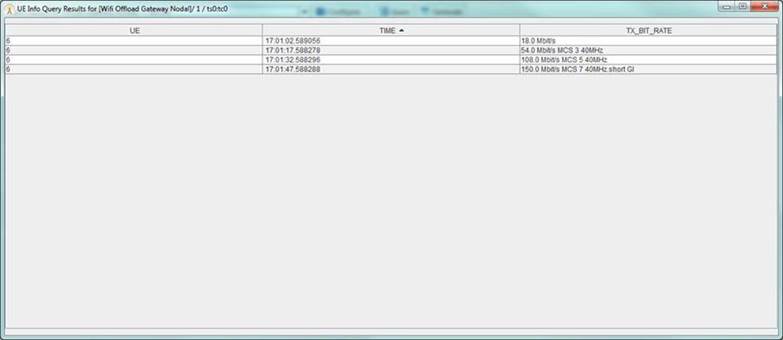
(Query selected UE's Field/Cell History), e.g. selected a single cell, Query UE 6 for TX_BIT_RATE history:
(Query selected Field/Column for all UEs), e.g. selected column, Query All UE’s for TX_BIT_RATE, see history of specific field across all live-reported UEs:
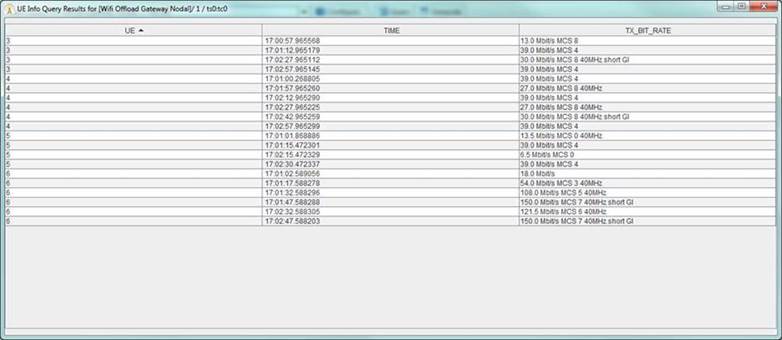
Results page is sortable by column.
The full monitored UE information results csv file will show up in end of test results:

Example content:
UE,TIME,COLUMN,VALUE
1, 09:36:24.327153,STATUS_OF_CLIENT,Idle
1, 09:36:24.327166,MAC_ADDR,f4:0f:2b:c1:4d:5c
2, 09:36:24.327756,STATUS_OF_CLIENT,Idle
2, 09:36:24.327765,MAC_ADDR,f4:0f:2b:c1:4d:5d
3, 09:36:24.327861,STATUS_OF_CLIENT,Idle
3, 09:36:24.327868,MAC_ADDR,f4:0f:2b:c1:4d:5e
4, 09:36:24.327954,STATUS_OF_CLIENT,Idle
4, 09:36:24.327958,MAC_ADDR,f4:0f:2b:c1:4d:5f
5, 09:36:24.328041,STATUS_OF_CLIENT,Idle
…
13, 09:38:43.718168,STATUS_OF_CLIENT,Idle
14, 09:38:43.933053,STATUS_OF_CLIENT,Idle
15, 09:38:44.119449,STATUS_OF_CLIENT,Idle
16, 09:38:44.319395,STATUS_OF_CLIENT,Idle
17, 09:38:44.519175,STATUS_OF_CLIENT,Idle
18, 09:38:44.719180,STATUS_OF_CLIENT,Idle
19, 09:38:44.918159,STATUS_OF_CLIENT,Idle
20, 09:38:45.118155,STATUS_OF_CLIENT,Idle
Values of STATUS_OF_CLIENT parameter when UE Info level is 10 and UE info monitoring / reporting configuration is enabled:
| Initial | Succeeded | Failed | |
| LS start U1 | Idle | Created | Failed to start |
| Timeout to start | |||
| U1 registration | Failed to register | ||
| Timeout to register | |||
| U1 read SIM | Failed to read SMS storage | ||
| Timeout to read SMS storage | |||
| U1 attach | Connected | Failed to connect | |
| Timeout to connect | |||
| Disconnected | |||
| LS get U1 ip | Failed to dhcp | ||
| Timeout to dhcp | |||
| Disconnected | |||
| LS & U1 ready for data traffic | Established | Disconnected |
Configuration of Pass/Fail Criteria - End of Test Criteria
The End Of Test Criteria allows you to set up Pass/Fail Criteria based on the values inside the UE Info report. You define them on a test case basis via the Info Tab.
|
NOTEs:
|

The overall Pass/Fail Status of the test is calculated based on the ANDing of overall pass fail criteria, plus each Test Case UE Info Criteria. On the main Pass/Fail tab, there is an summary indication of Test Case UE Info Criteria Status.

On the End of Test Criteria sub tab, the Test Case list will indicate a summary Status for each Test Case. You can click on each Test Case to see the detailed list of criteria for that test case:
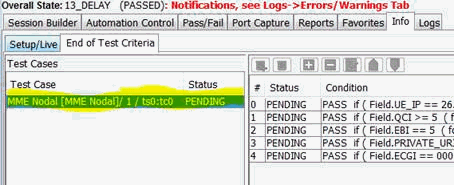
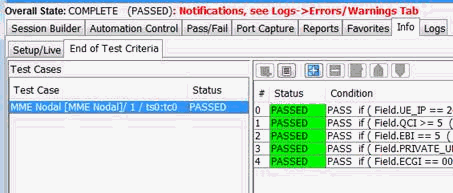
Criteria Status PENDING:
- If your UE Info, info_report.csv is not produced at all or if it is empty, your UE Info Criteria status will remain PENDING, and there will be messages in your test Run Log, search for "UE Info".
-
If your TC doesn't have any UE Info Criteria, it's status will be PENDING.
-
PENDING is ignored in calculating the overall Criteria status, it is like saying we didn't do it for one reason or another.
-
If your UE Info Status is PENDING, but you have defined Criteria for that TC, check your setup: check your UE Info Enabler, UE Info Level, info_report itself.
-
You should not define UE Info Criteria until you have first configured your test, executed it and analyzed the info_report to understand what fields are there and their values.
The Test Case -level UE Info PF-Status is reported in the Run Log, and this hooks into the "failures" link on results website.
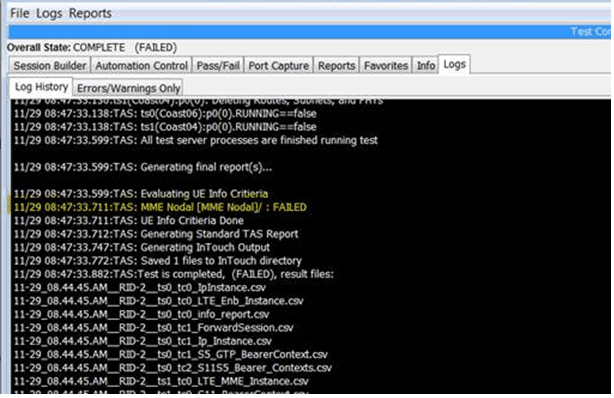
On results website you have the Criteria Failures link:

Which drives from the Run LOG:
http:///results/sms/11-29_08.44.45.AM__VoLTE-MME-AmrNb-BiDir-POLQA_10UEs_COAST4-6_wCrits_2__RID-2.log.txt
11/29 08:47:33.599:TAS: Generating final report(s)...
log: 11/29 08:47:33.599:TAS: Evaluating UE Info Criteria
log: 11/29 08:47:33.711:TAS: MME Nodal [MME Nodal]/ : FAILED
criteria: MME Nodal [MME Nodal]/ : FAILED
log: 11/29 08:47:33.711:TAS: UE Info Criteria Done
To give you just this:
http:///failedCriteria.cgi?sms+11-29_08.44.45.AM__VoLTE-MME-AmrNb-BiDir-POLQA_10UEs_COAST4-6_wCrits_2__RID-2.log.txt
Failed Criteria
criteria: MME Nodal [MME Nodal]/ : FAILED
This is in lieu of printing every single UE Info PASS Fail Criteria in the main Run Log, instead they are in a separate csv file (seen in above listing):
http:///results/sms/11-29_08.44.45.AM__VoLTE-MME-AmrNb-BiDir-POLQA_10UEs_COAST4-6_wCrits_2__RID-2__ue_info_criteria.txt
ts,tc,crit,condition,status
0,0,-1,MME Nodal [MME Nodal]/ ,FAILED
0,0,0,[ PASS if (Field.UE_IP == 26.0.0.1) ],PASSED
0,0,1,[ PASS if (Field.QCI >= 9 ( for UE <= 1 )) ],FAILED
0,0,2,[ PASS if (Field.EBI == 5 ( for UE >= 1 )) ],PASSED
0,0,3,[ PASS if (Field.PRIVATE_URI matches sip.*) ],PASSED
0,0,4,[ PASS if (Field.ECGI == 000.000.1 ( for UE-Bearer with Field.IMSI == 505024101215074 )) ],PASSED
|
NOTE: For UE Info Criteria to work properly, UE Info monitoring must be enabled, UE Info Level should be set to 10 on Test Server Configuration (or less if you know which fields are produced). |
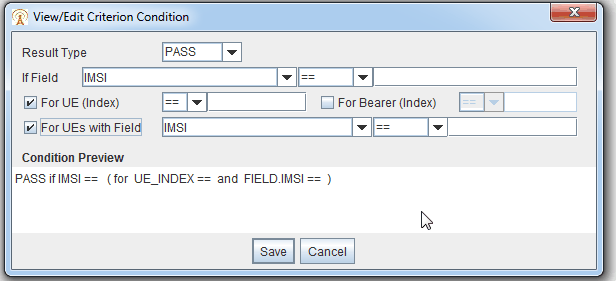
UE Criterion Editor
Use the UE Criterion Editor (Add/View/Edit) to create Info Pass/Fail Criteria.
