About The Landslide Results Manager
The Landslide Results Manager is a tool for analyzing and presenting test data. It allows you to read end of test results generated on TAS, measurements (meas.db), and per session statistics files (.csv files). Using the Landslide Results Manager (meas.db files), you can setup templates of graphs and tables and rules to automatically load these templates when you open test results.
Setting up graphs and custom tables assists you to showcase the important information for a test case/session. Setting up template and rules assists you with analysis of future runs of the same test in a quick and simple manner. You can also switch between different templates, save graph images or export as html report.
The meas.db file is generated when you select the option to generate the database on the Reports Options window ( Test Session tab> Report Options).
|
TIP: Use filtering measurements to report only the required measurements to ensure the database size does not get very large (database generation with large test sessions over long periods of time may slow the TAS down). |
You can then retrieve these database files and view them in the Landslide Results Manager. You can Launch the Landslide Results Manager from the Landslide main window or from the Test Session window.
| NOTE: You may open the results database in SQLite database browser to see the schema. |
Open Landslide Results Manager from the Landslide Main Window
-
Click the Launch button on the Landslide Results Manager panel of the main window, and your browser will attempt to download the Landslide Results Manager application. This may take more than a minute with a slow connection speed and will only occur on subsequent sessions if the test system has been upgraded.
Open Landslide Results Center (Beta) from the Landslide Main Window
-
Click the Launch button on the Landslide Results Center panel of the main window, and your browser will attempt to download the Landslide Results Center application. Landslide Home Page Results Center (Beta, new for 24.3).
Open the Landslide Results Manager Test Session Window
When the test has completed, the database is available on TAS for you to retrieve and view.
-
Click Reports on the Test Session Menu and click Retrieve All Test Result Files (files are transferred to your local directory).
-
Select the database file to open and the Landslide Results Manager launches.
| NOTE: The Landslide Results Manager does not require you to login. |
See the Landslide Result Manager templates in Test Sessions document for information on how to create Landslide Results Manager Templates in a Test Session.
The following topics are included:
Landslide Results Manager Main Window
(With meas.db)
Elements of the Landslide Results Manager
The Landslide Results Manager consists of a split pane with a tree structure in the left pane and a display panel in the right pane. The Landslide Results Manager is essentially a blank slate populated only when you open either the csv or database file generated by TAS.
-
The Main Menu bar.
-
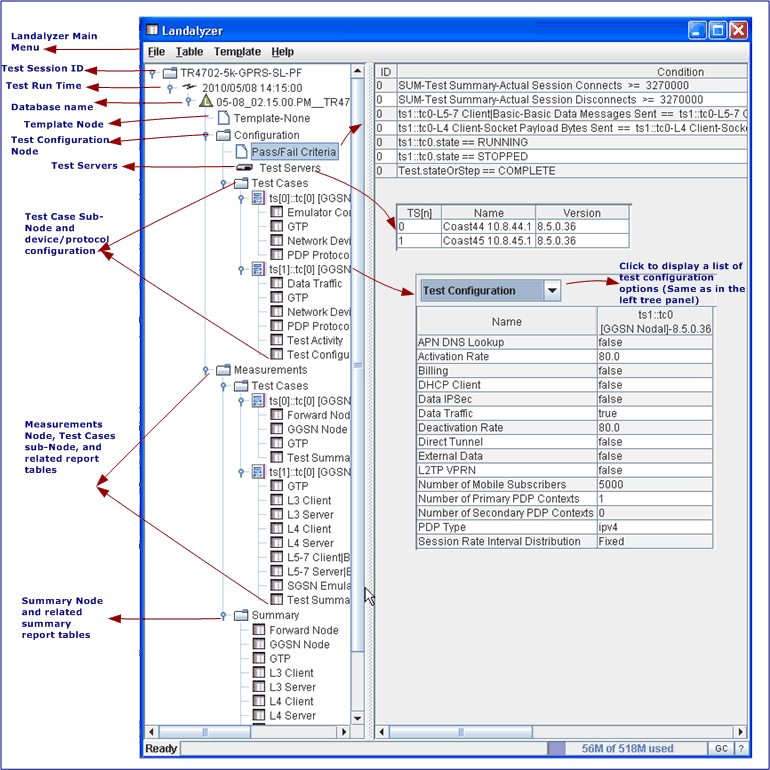
The Main node identified by the Test Session ID/name is a container for many sub-nodes and relevant information.
When you open a CSV file, only the Test Case sub node displays and the following nodes are not applicable.
-
Template allows you to define/create custom graphs and tables that you would like to setup once and view them often. You may set up Matching Rules to automatically associate the template with a given test session or test case and also generate a template report.
-
Configuration displays the test session configuration information.
-
Measurements displays the end of test results and any graphs you create.
-
Summary displays the aggregate measurements across all protocols used in the test
-
Right-Click Menu Options: Depending on which tree node you right-click, a popup menu appears with options to close, save, add, delete, or rename files, templates, graphs, or tables.
-
-
Close Test Session — This option appears only when you click on the Test Session Node.
-
Close Test Run — These options appear only when you click on any tree node below the main Test Session node.
-
Close Test Session, Test Run, Close File — These options appear when you click on any tree node below the Test Run node.
-
Close, Save, Template Add Multi-Content Node — These options appear only when you click on the Template node.
-
Delete, Rename Graph or Table — These options appear only when you click on either the graph or the table branch of the Template node.
-
Main Menu
The Landslide Results Manager main menu bar options include the following:
File
The File menu provides you with the following options:
- Open a file from the local directory: meas.db or CSV files
- Close an open file
- Preferences window allows you to perform the following tasks:
- Change the GUI Look and Feel: The default GUI skin is the Java Metal. Select the desired look and feel from the dropdown list.
- Load Entire Database to Memory (In background): Select the checkbox to load the entire database in memory.
- Cache Generated Tables/Graphs: Select the number of tables/graphs you want cached from the dropdown list. Options are 0, 10, 50, 100, and the default is 50.
- Save: Click this button to save your preferences.
- Exit an open database file.
Table
The Table menu options are available only when you select a table either from the Template node, Measurements node, or the Summary node.
- Export Table to .CSV File
- Per Interval: This checkbox is a toggle to show per-interval values or cumulative values.
- Select the checkbox to show only the per-interval values in the table.
- Clear the checkbox to show cumulative values.
- Hide Empty Columns: This checkbox is a toggle to show hide zero-value columns or show all the columns.
- Select the checkbox to hide all columns that are empty or zero values in the table.
- Clear the checkbox to show all the columns in the table.
Template
The Template menu provides you two options:
- The Matching Rules option allows you to set up matching rules to automatically associate with a given test session or a test case. You can set up the matching rules only after you have set a template. Setting up template and rules assists you with analysis of future runs of the same test in a quick and simple manner.
- The Generate Template Report, saves all template nodes to a html file.
Click the Matching Rules option and the Template Auto-Load Matching Rules window displays.
Use the button bar at the bottom of the window to add a new matching rule, Select and delete a matching rule, move the rule up or down, save and close the rule, or cancel/discard any changes.
|
Label |
Description |
|
# |
Indicates the matching rule number. |
|
Match |
Indicates whether the matching rule by the Test Session Name or the Test Case Type. |
|
Comparison |
Indicates the criteria for comparison : Equals, StartsWith, EndsWith, Matches, Contains |
|
Value |
Indicates the value for comparison. For example, instance of the Test Session, test case type, etc. |
|
Template to Open |
Indicates the templates to open automatically. A list of templates in the template node displays for selection. Select templates to load automatically when you open the database. This allows you to view/analyze data without having to create graphs/templates every time. |
Help
Click to display this help file.
Main Node
The Main Node includes the test session node, test session instance identified by the test run time, end of test result database file and all related configuration, measurements, summary, and the template node.
You may expand or collapse the tree at each of the nodes or sub-nodes.
Configuration
The Configuration node includes three sub-nodes, Pass/Fail Criteria, Test Servers, and Test Cases. Clicking on each of the sub-nodes displays the relevant configuration information on the right-hand information panel. See the Landslide Results Manager Main Window for reference.
Double clicking on the Test Case sub-node expands and displays each test case configuration in the instance of the test session. Select a sub-node or a branch to display the relevant configuration information on the right-hand information panel.
Measurements
The Measurements node includes the Test Cases and Summary sub nodes. Clicking on each of the sub-nodes displays the relevant configuration information on the right-hand information panel. See the Landslide Results Manager Main Window for reference.
Test Cases
When database files are open, the test cases are listed in the same order as they appear on the Test Session Tab. Each test case displays measurements on separate sub-tabs for mobile subscribers, the physical or simulated devices included in the test, and protocols as defined in the test session. See About the Reports Tab topic for more information.
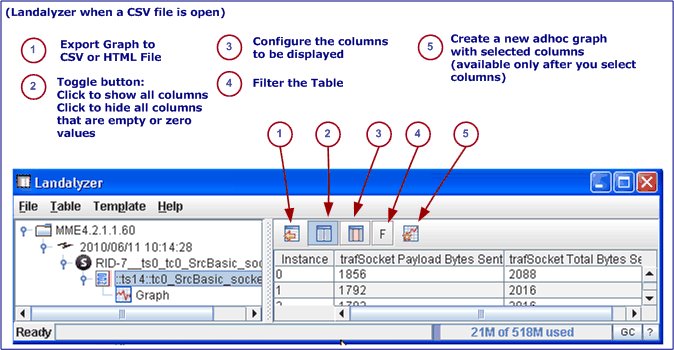
The csv file is opens a test case instance and the test case buttons are different from when a database file is open.
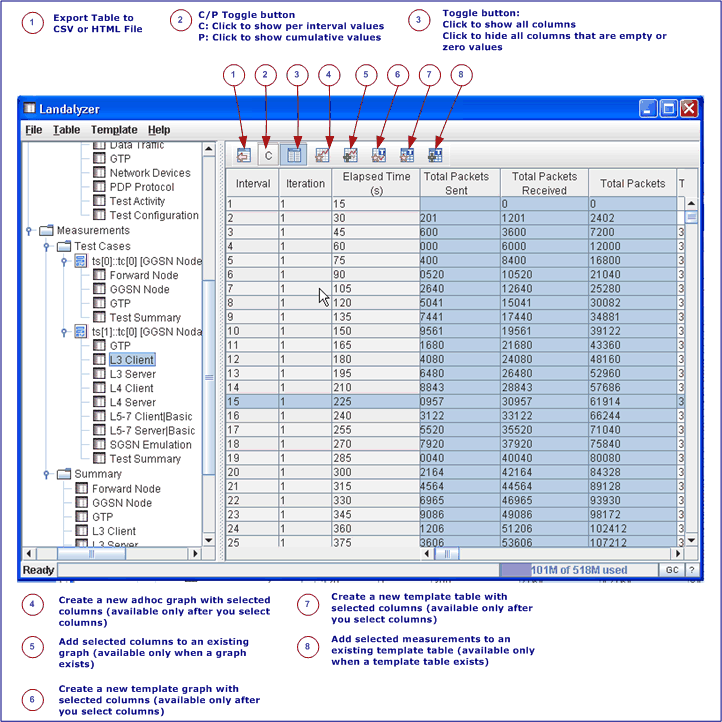
Each test case measurement tab displays the measurement values collected during test activities. These measurement values are displayed in a grid made up of rows of measurements and columns of interval values and are logically grouped together.
The test case measurement view provides you with action buttons to perform tasks, which assist you in viewing/analyzing required measurement data. You may select the required values (rows and columns of data), create graphs using the button bar and analyze the results data.
|
Descriptions (when database file is open) |
|
|
Click this button to export the displayed report table to your local directory as a .CSV file or a HTML file. |
|
|
Click the toggle button to either show per interval values or cumulative values.
|
|
| |
Click the toggle button to either hide all zero columns or show all columns.
|
| |
Create a new ad hoc graph with selected columns (available only after you select columns). Creates a graph and adds a graph node below the selected measurements table node. |
|
Add selected columns to an existing graph (available only when a graph exists). |
|
| |
Create a new template graph with selected columns (available only after you select columns). |
| |
Create a new template table with selected columns (available only after you select columns). |
|
Add selected measurements to an existing table (available only when a template table exists). |
Main Window with a CSV File
Graphs
You may create graphs in Landslide Results Manager by selecting the required rows and columns in the measurement table and click the Create Graph button. A graph displays based on the values you selected.
The graph view provides you with buttons which allows you to perform various tasks, which assist you in viewing/analyzing the graph. Refer to About the Graph Tab for details.
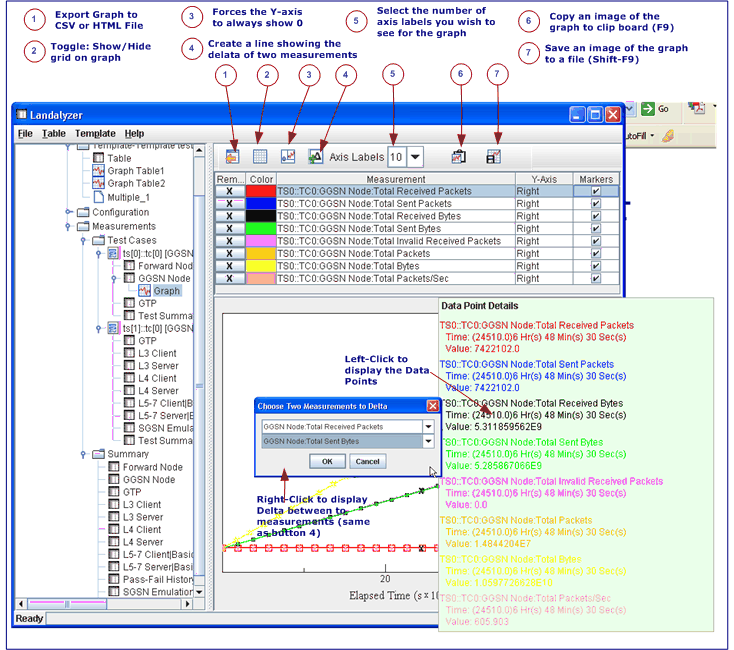
|
Description |
|
|
|
Exports Graph to .CSV File |
|
Toggle: Shows/Hides grid on graph |
|
|
Forces the Y-axis to always show 0 |
|
|
Toggle: Creates/removes a line showing the delta of two measurements |
|
|
Allows you to select the number of axis labels you wish to see for the graph. |
|
|
Copies an image of the graph to clip board (F9) |
|
|
Saves an image of the graph to a file (Shift-F9) |
Summary
The values on the Summary sub nodes report the aggregate measurements of each of the protocols, devices, emulators used in the test, on separate sub-tabs.
The Summary measurement view provides you with action buttons (similar to those provided on the Test Case measurement sub nodes) to perform tasks, which assist you in viewing/analyzing required measurement data. You may select the required values (rows and columns of data), create graphs using the button bar and analyze the results data.
Template
You may create template table, template graphs, or add multiple-content node and recall them to understand/analyze your test performance. Once you setup the Templates with the selected data, you can view these template graphs or table under the Template Node, to determine how your test performed.
After creating, your custom graphs and tables you can use the Landslide Results Manager Matching Rules to automatically associate the templates with a given test case or session.
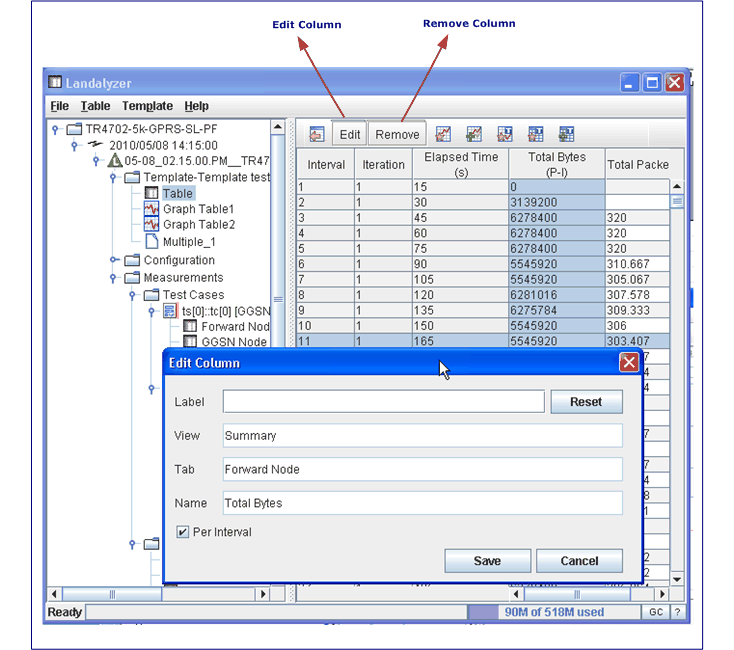
Template Table
When you click the Create New Template Table button from the Graph sub node, a template table appears. The action buttons available are similar to the measurement tables of Test Cases sub node, except for toggle buttons, which are replaced by the Edit and Remove buttons.
|
Description |
|
|
Exports the displayed report table to your local directory as a .CSV or HTML file. |
|
| |
Display the Edit Column window. You can perform the following actions:
The following identifies the data/column
|
| |
Click the Remove button to delete the selected column. |
|
Creates a new ad hoc graph with selected columns (available only after you select columns). Adds a graph branch node below the selected template table node. |
|
|
Adds selected columns to an existing graph (available only when a graph exists). |
|
|
Creates a new template graph with selected columns (available only after you select columns). |
|
|
Creates a new template table with selected columns (available only after you select columns). |
|
|
Adds selected measurements to an existing table (available only when a template table exists). |
Template Graph
When you click the Create New Template Graph button from the Test Case Graph sub node, a template graph appears. This template allows you to perform all the actions similar to those on the Test Case Graph sub node.
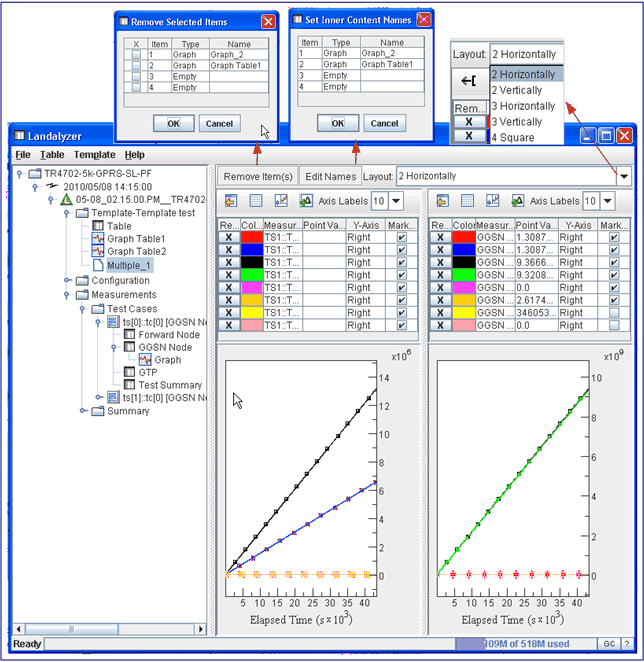
Multi-Content Node
You can add a multi-content node from right-click menu on the Template Node. The multi-content node allows you to view all the graphs in a single view for comparison. You may view a maximum of 4 graphs at a time and you may choose to view them either horizontally or vertically. You may also remove selected items from the multi-content node and rename the inner contents of the multi-content node.