Data Tuning
Available in AMF Nodal, IP Application Node, MME Nodal and SMF Nodal test cases when Data Tuning Auto is enabled. Auto increase /decrease based on the Test Servers health OR triggered OMs to help improve the Landslide system behavior upon:
- Congested network
- Message buffer exhaustion
- CPU overload
- socket layer issues such as time-out/packet loss, etc (measurement OM)
The system may back off automatically upon detection of events listed above, and then recover the level of load once it's back to normal.
When Data Tuning Manual is enabled, use the Data Tuning Tab to be able to adjust (attach / detach) the number of sessions established (mobile or UE) during a running test. See details below for Manual Mode
|
Auto Settings
|
Auto Settings
|
|
Trigger Settings |
Trigger Settings CPU Load
|
|
Measurement Monitoring |
Data Tuning
Auto Settings
Trigger Settings
CPU Load Event
Avg(total) = (Avg_All_cores(1) + Avg_All_cores(2) + Avg_All_cores(3)) / 3
Data Tuning will record the average percentage of CPU's core at every interval (Avg(1, 2, 3, ...,n). If the average of the last three intervals (Avg(total) exceed Load Threshold, negative event will trigger.
|
Data Tuning to monitor the load of control thread (s). Tcl Parameter: DataTuneCtrlLoadMonEn |
|
|
Data Tuning to monitor the load of Data thread (s). Tcl Parameter: DataTuneDataLoadMonEn |
|
|
Threshold to trigger negative event (System overload). Available if "Enable Control Load Monitor" or "Enable Data Load Monitor" is selected. Range: 1 to 100, Default: 80 percent Tcl Parameter: DataTuneLoadMonThresh |
Measurement Monitoring
Measurement Event
|
Add a measurement to monitor (similar to Favorites Tab). Measurement configuration is dynamic and the OM tabs available in the cell editor for the measurement table are set at GUI start-up. Changes to the test configuration may not show up in this configuration tab until after the GUI is closed and reopened. Enter the Number of Measurements to monitor (up to 20) and enter the :
Tcl Parameter: DataTuneNumMeas Tcl Parameter: DataTuneMeas_1 Tcl Parameter: DataTuneThreshold_1 |
Auto increase/decrease based on TS's health OR triggered OMs
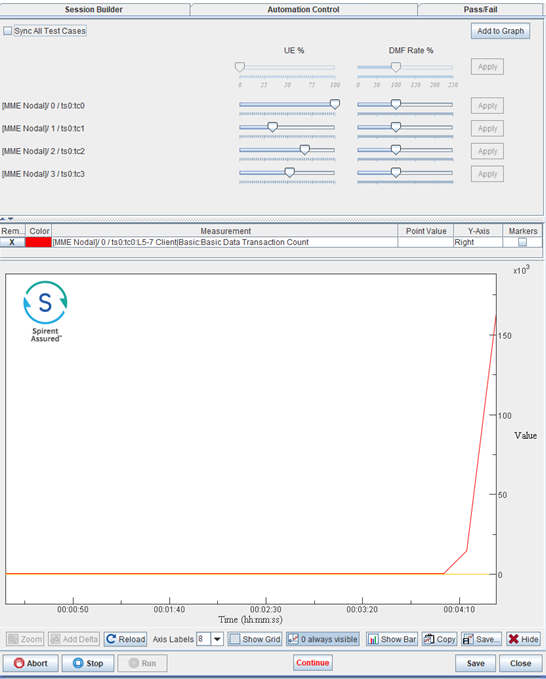
Sample successful Data Tuning, Auto mode:

Manual Mode Settings
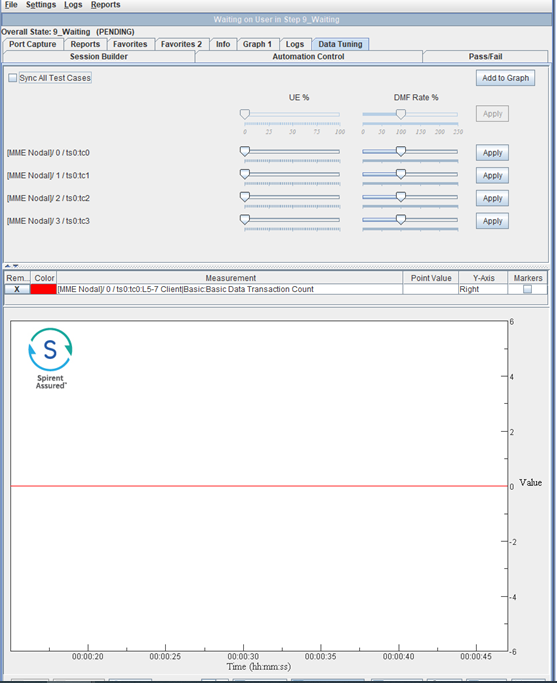
Use the Data Tuning Tab to be able to adjust (attach / detach) the number of sessions established (mobile or UE) during a running test. Available in AMF Nodal, IP Application Node, MME Nodal and SMF Nodal test cases when Data Tuning Manual is enabled. Available when Manual Mode is enabled.
When the test is started, the Data Tuning tab appears. Initially no UEs are attached. You can start them manually by adjusting the UE % slider bar. The number of UEs running independently can be adjusted for each process. You can also adjust the DMF Rate %. It is initially configured to do 100% of the configured rate. It can be adjusted up to 250% of the configured transaction rate. Thus, if the configured transaction rate is 100 you can increase it to 250. Likewise you can go the other way and reduce the transaction rate.
Select "Sync All Test Cases" to Synchronize all test cases in the session.
Use the "Add to Graph" to add measurements to the Graph Below. Additional details in this topic - About the Graph


Learn how to: