Retrieve Test Server Logs and Debug Trace
Use the Test Server Administration window... to retrieve the Test Server Logs and set Debug Trace.
To retrieve Test Server Logs files:
-
Click the Logs button and you will be prompted to login to the test server. Select SSH Connection Options prior to logging in to the test server. In order to retrieve the Test Server log files, the Client should have network connectivity to the Test Server for accessing SSH services. Alternatively, the Client can SSH to the TAS first, then SSH to the Test Server. Select Direct to TS @ to select the option to directly access the TS from your client and pick the IP address that the client can reach the TS or Tunnel via TAS @ to select the option to tunnel through the TAS to reach the TS and then choose the IP address that you connected to the TAS with, and if needed any special TAS SSH Port. Check the "Only show this dialog on connection failures" to hide it going forward. The standard way is directly to the TS at the Management Address and defined SSH port. However, if the TS has other IP Addresses known, such as VPN IP, or forced SSH Address, these will be choices in the first combo box. The other option is to tunnel through the TAS. The client will first SSH to the TAS, and then use the standard SSH configuration that the TAS uses, to SSH to the TS. The TAS may also have two IP Addresses. In some configurations there is a separate Public IP Address.
-
Enter the test server's cfguser password and click OK. The Retrieve Test Server Log Files window displays with a list of available log files on the test server.
-
Select the required log files and click the Retrieve button to download the files to your local disk.
-
Retrieve TS Logs opens the Login to List and Retrieve Log Files window, login as cfguser, which then opens the Retrieve Test Server Log Files window.
-
Select the log files for the test case instance from the Instance list.
-
Retrieve Tarball is available when no log files are selected. Click to generate a Tarball, select a location, enter the file name to save. The generated Tarball is downloaded to the specified location.
-
The Retrieve Tarball option allows you to gather all log files in one attempt instead of trying to figure which logs to retrieve, for example, in scenarios where a Test Server has crashed many times. It contains logs for OS and all TS-Processes in a single tar.gz.
-
NOTE: Clicking Retrieve Tarball calls the TS command-line utility get-ts-logs to generate a tarball (may take a few seconds). It contains logs for OS and all TS-Processes in a single tar.gz. By default the file name format is: TS+[TS NAME]+-all_ts_logs.tar.gz, for example, TSdev26-all_ts_logs.tar.gz.
-
Retrieve is available when you select one or more log files to be retrieved to a specified location.
To Set Debug Trace:
-
Click the Debug/Trace button and the Set Test Server Debug/Trace Level window opens.
-
Select the Set Debug Mode check box and then select the debug mode as Enabled or Disabled from the dropdown list.
-
Select Set Trace Snapshot and enter the size of the snpashot buffer. Enter the buffer size units (x1024) and MiB or GiB. Buffer size default = 200 MiB. The buffer size cannot be more than 25% of the remaining memory at the time of the setup. If it is set above this level, it will be automatically lowered to 25% of the remaining memory.
-
Or Select Set Normal Trace from the list.
-
In order to Set Test Server Debug/Trace Level, the Client should have network connectivity to the Test Server for accessing SSH services. Alternatively, the Client can SSH to the TAS first, then SSH to the Test Server. Select Direct to TS @ to select the option to directly access the TS from your client and pick the IP address that the client can reach the TS or Tunnel via TAS @ to select the option to tunnel through the TAS to reach the TS and then choose the IP address that you connected to the TAS with, and if needed any special TAS SSH Port. The standard way is directly to the TS at the Management Address and defined SSH port. However, if the TS has other IP Addresses known, such as VPN IP, or forced SSH Address, these will be choices in the first combo box. The other option is to tunnel through the TAS. The client will first SSH to the TAS, and then use the standard SSH configuration that the TAS uses, to SSH to the TS. The TAS may also have two IP Addresses. In some configurations there is a separate Public IP Address.
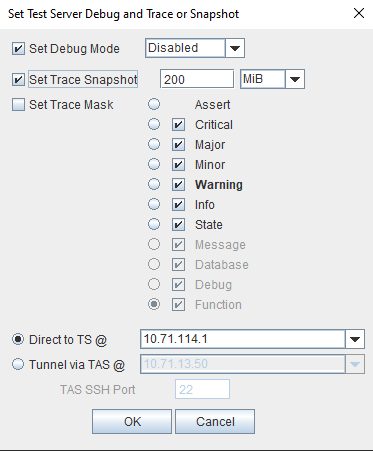
The Debug/Trace GUI as shown above: Set the Trace Mask. With the bit-mapped scheme you are able to set individual “levels” of trace. For example, you can set the trace to only print Info messages without the levels below that. You can set multiple levels, for example you can set the trace to print Debug and Major messages only.
The GUI (and command line “trace” function) provide a means to set select individual levels as well as the ability to set “all levels below” a level (much like the previous capability).
The Debug/Trace GUI as shown above: Set the Trace Mask.
Options : Assert, Critical, Major, Major, Warning, Info, State, Message, Database, Debug ,and Function messages only.
Selecting the circle instead of the square check box enables that trace type and all types below it.
The TS supports toggling Debug Mode and settings trace levels for both regular Trace function and the Snapshot.
When Debug Mode is changed, it will recycle the Test Server (TS) as it changes out the binary. When debug mode is enabled a different binary is actually executed that contains more logging code and is less efficient. It supports Trace Masks/Level up to bit 10. When regular mode is enabled only Trace Mask/Level bit 6 is supported.
When the Trace level is changed, it will be done after the optional Debug mode change so that the level is changed on the newly running TS (ssesh).
The default Trace level is 4, which equates to bitmask 31 and includes Assert, Critical, Major, Minor and Warning levels. When the default level is set the TS Admin General Tab will not show any indication about Trace Level.
The default Trace Snapshot bitmask is 0, i.e. just Assert and expected to be with 0 buffer size, which means Snapshot is turned off. Only Trace Snapshots > 0 will be displayed in the TS Admin General Tab.
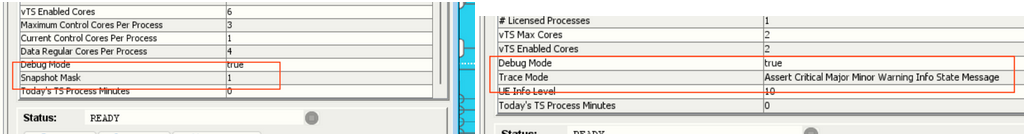
When Debug is turned on and Normal Trace or Trace Snapshot enabled the non-default set of the levels, the TS Admin (and TS object in APIs) will have Debug Mode, Trace Mode and/or Snapshot Mask reported:
| Function | Debug | Database | Message | State | Info | Warning | Minor | Major | Critical | Assert | |
| Bit | 10 | 9 | 8 | 7 | 6 | 5 | 4 | 3 | 2 | 1 | 0 |
| Mask(single value) | 1024 | 512 | 256 | 128 | 64 | 32 | 16 | 8 | 4 | 2 | 1 |
| Mask(sum value) | 2047 | 1023 | 511 | 255 | 127 | 65 | 31 | 15 | 7 | 3 | 1 |
trace_mode ="Assert Critical Major Minor Warning" - Descriptive Enum list of Trace levels enabled.
trace_level = "31" - Integer mask value for tracing function.
ss_level = "511" - Integer mask value for snapshot tracing function
Tcl and REST API have additional read-only attribute on the TS, "SnapshotMask". Indicating the current Trace Levels applied to the Snapshot, as seen in TS Admin when mask > 0.
The Command Line Interface Commands “trace” function supports both form of trace are supported.
From the CLI, the commands are
| enable-debug ---- Switch TS to debug mode |
| disable-debug --- Switch TS to normal mode |
| trace ----------- Set trace level on TS when in debug mode |
To enabled/disable Debug mode, use the enable-debug and disable-debug commands.
To set Trace Level, use the trace command:
trace -t LEVEL_INT -d PROCESS_PORT, e.g. trace -t 10 -d 8892
trace -t MASK_NAME < -t MASK2_NAME > -d PROCESS_PORT, e.g. trace -t Major -t Warning -d 8892
trace -g LEVEL_INT:SNAPSHOT_SIZE -d PROCESS_PORT, e.g. e.g. trace -g1024:5G
trace -g MASK_NAME < -t MASK2_NAME:SNAPSHOT_SIZE, e.g trace -gWarning: -gInfo:200M
Snapshot Trace Level details:
Snapshot trace option “-g” saves snapshot trace logging into a circular FIFO buffer.
A compressed file will be written when TS gets into Panic Mode (restarted) or
when snapshot buffer size changes or
when snapshot trace level changes lower than current level
Snapshot file name is “ts_snapshot.log.*.gz” , where * is file index as exists in other TS logs.
It supports TRACE_XXXX macros up-to Function Exit level (10) on debug version and up-to State level (6) on release version like normal trace logging. Both regular -t trace and -g trace can be enabled at the same time.
but -g and -t just require separate commands when we set them.
From the CLI Command Line Interface Commands, the commands:
To turn on snapshot:
trace -g LEVEL_INT e.g. trace -g9
trace -g LEVEL_INT:SNAPSHOT_SIZE , e.g. trace -g9:200m
With MASK_NAME
trace -g MASK_NAME, e.g. trace -gWarning -gInfo
trace -g MSASK_NAME:BUFFER_SIZE, e.g trace -gWarning:200m -gInfo
To turn it off, use command
-gAssert:0
Snapshot buffer size (SNAPSHOT_SIZE):
Initial size is 200 MB.
Size must be < 25% of remaining memory. If set above this it will be automatically lowered to 25% of remaining memory.
Sizes are specified by a number and optional units. Units are M, m, g and G and correspond to MiB, and GiB respectfully. See below examples:
trace -g9:300M ##300 MiB
trace -g9:300m ## 300 MiB
trace -g9:5G ##5 GiB
| NOTE: Trace level checks occur before file name filtering occurs thus the only messages with the level set are output for the file(s). To get all traces for the file, trace –tFull or trace –iFunction would need to be done as well. |
Related Topics